

The Loneliest Number
What a batting average actually measures — and why .350 is basically a miracle

Last night I was at Chase Field watching the Arizona Diamondbacks. At some point I looked up at the lineup board — nine names glowing in teal against the desert dark — and I had a thought that wouldn’t let go.
Each of those nine men will walk to a four-foot-wide rectangle of dirt, alone, and attempt to do something that the entire opposing organization — its coaches, its analysts, its pitchers, its fielders, and its data infrastructure — has spent months preparing to make impossible.
And if the best of them succeeds three times out of ten, he’ll be considered excellent.
That number, the batting average, looks simple. It’s a fraction: hits divided by at-bats. But what it actually measures is something far more interesting than hitting proficiency.
It measures survival.
Start With a 1.000
Here is a thought experiment.
Every batter steps into the box with a perfect 1.000 — a complete possibility. We colloquially call this “batting a thousand.” Everything is still in front of him. The hit exists, somewhere in the probability space of the next few seconds, waiting to either materialize or be destroyed.
What happens to it?
What follows is not metaphor. It is, as close as current research allows, the actual math of what the system does to that 1.000 before the at-bat is over.
The Time Problem — ×.72 — Running Total: .720
The pitcher releases the ball at roughly 94 miles per hour. That is close to the current MLB average — and it means the ball covers sixty feet, six inches in approximately 395 milliseconds.
The human brain requires between 150 and 200 milliseconds just to process what the eyes are seeing.
By the time a batter’s brain has registered what pitch is coming, the window to swing has already closed or is closing. He cannot react to the ball in any meaningful sense. He is making a prediction — based on the pitcher’s arm angle, release point, grip, and the first few feet of flight — and committing to that prediction before conscious confirmation is possible.
He is not hitting the ball. He is betting on it. Every single time.
The 1.000 is now .720.
For context: in 2008, when MLB first began systematically tracking pitch velocity, the average four-seam fastball was 91.1 mph. That sounds like a modest three-mile-per-hour difference. In terms of the reaction window available to the batter, it represents the difference between a nearly impossible task and an even more nearly impossible one. The average has gone up every single year since — without exception.
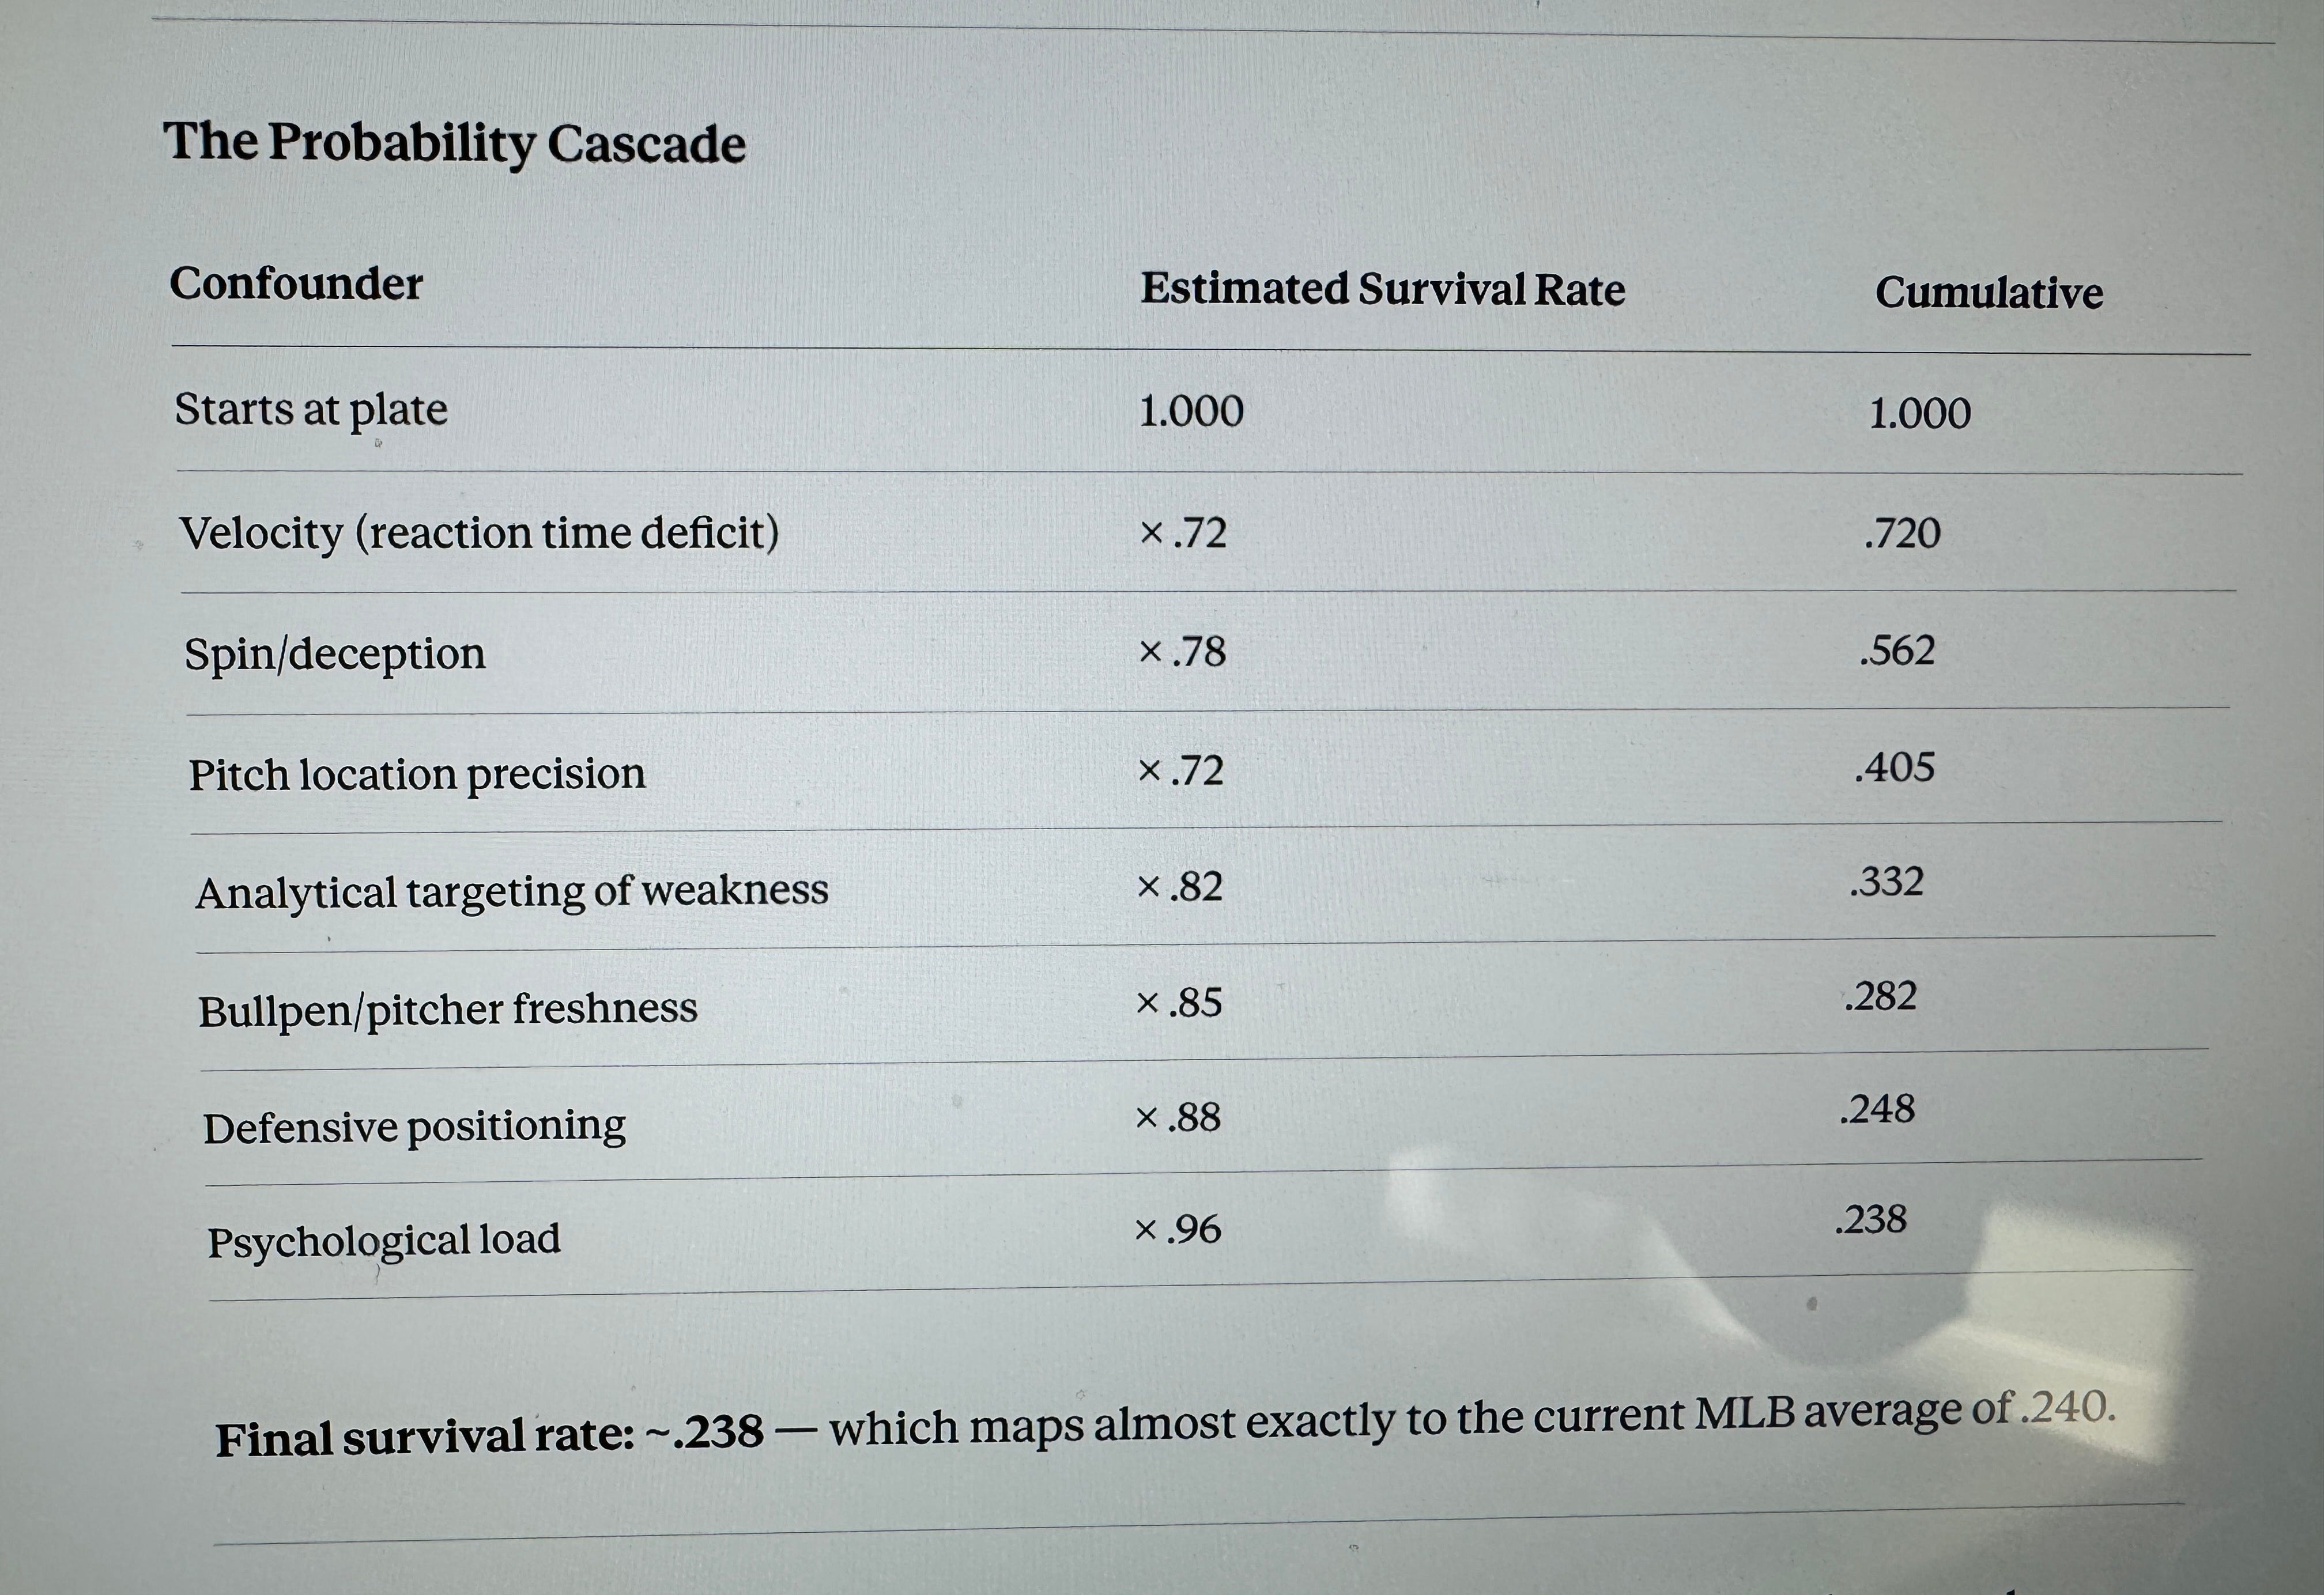
The Deception Problem — ×.78 — Running Total: .562
Velocity alone would be manageable. The human nervous system is adaptive. Given enough repetitions, a batter could theoretically calibrate to 94 mph.
But the ball is also lying to him.
Spin rate is the mechanism. A four-seam fastball thrown with elite backspin creates an optical illusion: the ball appears to the batter to be rising, defying gravity, arriving higher than physics allows. He adjusts upward. He swings over it.
A breaking ball with elite topspin does the opposite — it appears to be tracking on a catchable plane and then drops off the table as it crosses the zone. He holds his swing a fraction too long, or commits to a pitch that isn’t there.
The average spin rate on sliders and curveballs has risen from roughly 2,106 revolutions per minute in 2015 to 2,475 RPM in 2024. That’s not a minor refinement. That’s a systematic enhancement of the lie the ball tells the batter’s eyes — developed deliberately, tracked precisely, and improved continuously.
He’s not just being deceived. He’s being deceived with increasing scientific precision.
The 1.000 is now .562.
The Intelligence Problem — ×.72 — Running Total: .405
Here is where it gets genuinely uncomfortable.
Every at-bat this batter has ever had is in a database. The pitches he chased out of the zone. The counts where he expands his strike zone. The sequences that made him look foolish. The location in his stance where he is weakest. All of it has been analyzed. Tendencies extracted. A game plan built around that data, specific to him, updated continuously as new information arrives.
The pitcher on the mound is, in a meaningful sense, executing a machine learning output. He knows — because his coaches told him, because the scouting report told him, because Statcast told him — exactly which pitch in which location at which point in the count produces the highest probability of a favorable outcome against this particular human being.
Research confirms what any batter already knows in his bones: when a pitcher hits his intended spot, batter success rates fall by more than half. It is not just what is thrown. It is the precision of where it lands.
The batter has his own preparation, his own film study, his own instincts built over decades. But he is one person with finite time. The intelligence arrayed against him is institutional, continuous, and improving.
The 1.000 is now .405.
The Volume Problem — ×.85 — Running Total: .344
Not long ago, a batter would face the same starting pitcher multiple times in a single game — building pattern recognition, learning tendencies, adjusting at-bat by at-bat. That pitcher would stay in the game until he tired or faltered, giving the lineup time to solve him.
That era is largely over.
Modern pitching strategy is built around specialization and freshness. A batter might face four or five different arms in a single game — each optimized for a specific role, each carrying a different arm slot, velocity profile, and pitch arsenal, each entering fresh while the batter accumulates fatigue and cognitive load.
There is no pattern to solve. There is only a new problem, every time, with a new pitcher who has studied you and whom you have limited information on. The information asymmetry consistently and deliberately favors the mound.
The 1.000 is now .344.
The Space Problem — ×.88 — Running Total: .303
For much of the last decade, teams added another layer: the defensive shift. Armed with years of batted-ball data showing where each hitter tends to put the ball in play, teams repositioned fielders to cover those zones — sometimes dramatically, with three infielders shading to one side of the diamond.
The batter could execute perfectly. He could read the pitch correctly, commit at the right moment, make solid contact, drive the ball exactly where his mechanics naturally send it — and be thrown out by a fielder standing there in advance because the data predicted exactly that outcome.
He hit it well. He was still out. The system had pre-solved his success.
MLB has since restricted the most extreme shifts. The underlying logic — using historical data to collapse the space available to each individual hitter — remains.
The 1.000 is now .303.
The Psychological Problem — ×.79 — Running Total: .239
None of the above accounts for the fact that all of it happens in front of tens of thousands of people, on camera, with his name and his average on the scoreboard, in a profession where failure is not just common but expected and utterly public.
Every other player on the field operates within a system that distributes responsibility. A shortstop who misplays a grounder shares the moment with the situation, the coverage, the defensive alignment. There is context. There is diffusion. There is recovery.
The batter steps into the box alone. The outcome is entirely his. No help is coming. And because failure is the norm — even for the very best — he must walk back to the dugout after failing, sit with it for approximately three minutes, and then be ready to do it again with the same composure and belief as if nothing happened.
Mental resilience is not a soft asset in this job. It is a core technical competency, without which all the physical skill in the world degrades rapidly and visibly.
The 1.000 is now .239.
The Number That Remains
The current MLB batting average is approximately .240.
That is not a coincidence. That is the system producing its output — the residue left after velocity, deception, intelligence, volume, positioning, and psychological pressure have each taken their cut.
The batting average doesn’t measure how good a hitter is in some abstract, graded sense. It measures what the system couldn’t take from him. It is not a score. It is what survived.
Which is why .350 is not an A+ on a hitting exam. It is evidence that a human being went to that box hundreds of times — against everything described above, a system that improves its ability to defeat him every single season — and the system failed to stop him more than one out of every three times.
That is not hitting proficiency. That is something closer to a force of nature.
The league batting average was .271 in 1999. It has fallen nearly every year since. The last player to hit .400 over a full season was Ted Williams in 1941, when fastballs averaged in the low-to-mid 80s, pitchers threw two or three pitch types, and “analytics” meant a manager’s gut. Whether that era or this one was actually harder is a genuine debate. What is not debatable is that the system has never stopped getting better at producing outs.
Nine names on a scoreboard. Nine people who will step into that box alone tonight. The best of them will succeed roughly three times in ten. They will be considered excellent.
Now you know what that number actually costs.
Next Up: What baseball figured out about understanding performance that business still hasn’t.

Brilliant. Just brilliant